
From Filing to Feeling: How to Make Your Annual Report a Strategic Masterpiece
For most companies, the Annual Report is a graveyard of data. It is a dense, statutory document produced reluctantly by the finance team, skimmed by the board, and ignored by everyone else. It is viewed as a compliance box to be ticked—a necessary evil of doing business.
- From Filing to Feeling: How to Make Your Annual Report a Strategic Masterpiece
- The "Why": Shifting the Mindset from Compliance to Communication
- Pillar 1: The Narrative Arc (Finding the "Theme")
- Pillar 2: The "MD&A" (Management Discussion and Analysis)
- Pillar 3: Visual Storytelling (Killing the Spreadsheet)
- Pillar 4: Forward-Looking Insights (The "Guidance")
- Pillar 5: The "Elephant in the Room" (Addressing Failure)
- The Role of Data Integrity: You Can't Spin Bad Data
- How Excellence Accounting Services (EAS) Crafts Your Story
- Frequently Asked Questions (FAQs) on Annual Reports
- Turn Your Data Into a Narrative.
This is a colossal waste of strategic potential. Your Annual Report is not just a report card; it is your company’s autobiography for the year. It is the single most comprehensive communication tool you have to tell your story to investors, employees, lenders, and the market. It is your chance to explain not just *what* happened, but *why* it happened, and *where* you are going next.
In the UAE’s competitive landscape, where investors are sophisticated and transparency is the new currency, a dry, numbers-only report is a liability. A truly insightful Annual Report builds trust, attracts capital, aligns your team, and differentiates your brand. It transforms you from a “black box” into a transparent, visionary leader.
This guide is for the CEO, CFO, and business owner who wants to stop publishing “data dumps” and start publishing insights. We will explore the art of narrative, the power of visualization, and the strategic framework needed to turn your year-end filing into your most valuable marketing asset.
Key Takeaways
- Narrative Over Numbers: Numbers are the evidence, not the story. An insightful report weaves data into a compelling narrative of challenge, strategy, and triumph.
- Context is King: Revenue growth means nothing without context. Compare your performance to the market, your competitors, and your own history to show *true* performance.
- Forward-Looking Focus: Don’t just report the past (historiography). Use the report to sell your vision of the future (strategy), supported by your past success.
- Visualize to Persuade: Dense tables hide the truth. Use clear, strategic charts (waterfalls, bridges) to make complex financial concepts instantly understandable.
- Transparency Builds Valuation: Honest discussion of risks and failures builds more trust (and valuation) than a “perfect” report that hides the truth.
The “Why”: Shifting the Mindset from Compliance to Communication
Before you write a single word, you must shift your mindset. Most Annual Reports fail because they are written for the wrong reason.
- The Compliance Mindset: “We need to produce this document to satisfy the bank/FTA/shareholders so we don’t get fined.” Result: A boring, defensive document.
- The Communication Mindset: “We have a powerful story to tell about how we navigated a tough year and positioned ourselves for growth. We want our stakeholders to understand our strategy.” Result: An engaging, persuasive asset.
An insightful report is a marketing document for your stock (or value). It answers the investor’s core question: “Why should I trust you with my capital next year?”
Pillar 1: The Narrative Arc (Finding the “Theme”)
A great movie has a theme. A great Annual Report needs one too. It shouldn’t be a random collection of department updates. It should have a single, unifying thread that ties everything together.
Examples of Strategic Themes:
- “Resilience in Volatility”: How you protected margins and cash flow despite a market downturn.
- “Investing for Scale”: Why profits were lower this year because you poured cash into R&D and new markets (the “J-Curve” story).
- “The Digital Pivot”: How you transformed your legacy operations into a tech-enabled powerhouse.
Once you have a theme, every section—from the CEO’s letter to the financial analysis—should reinforce it. If your theme is “Efficiency,” your operations section should highlight cost savings, and your financial section should highlight margin expansion.
Pillar 2: The “MD&A” (Management Discussion and Analysis)
This is the heart of the report. It is where the numbers get a voice. In many reports, this section is dry and descriptive (“Revenue went up 10%”). To be insightful, it must be *analytical* (“Revenue went up 10% *because*…”).
The “Bridge” Technique
Don’t just state the start and end points. Build a bridge.
Boring: “Net Profit increased from AED 1M to AED 1.5M.”
Insightful: “Our AED 500k profit increase was driven by three factors: 1. Volume (+300k): We sold 15% more units due to the new Dubai South branch. 2. Price (+100k): We successfully passed on a 2% inflation price hike. 3. Efficiency (+100k): Our new accounting system reduced admin costs. However, this was partially offset by a AED 100k increase in marketing spend.”
This tells the reader *exactly* what levers you pulled. It proves management is in control.
Pillar 3: Visual Storytelling (Killing the Spreadsheet)
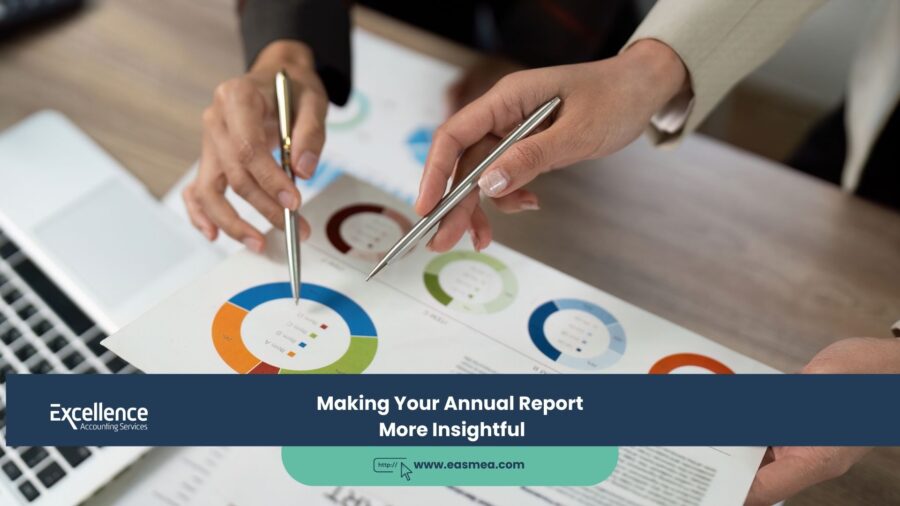
The human brain processes images 60,000 times faster than text. If your insights are buried in a table on page 42, they don’t exist. You must visualize your key messages.
The “Waterfall” Chart
This is the single best chart for an Annual Report. It visually explains the change in a number (e.g., Profit) from Year A to Year B. It shows green bars for positive drivers (Sales Growth, Price Increases) and red bars for negative drivers (Cost Inflation, R&D Investment). It creates an instant, intuitive understanding of your year.
The “Trend” Line
Never show just one year of data. Show 3 to 5 years.
Why? Context. A profit of 10% looks good. But if the trend is 15% -> 12% -> 10%, it’s a disaster story. If the trend is -5% -> 2% -> 10%, it’s a turnaround triumph story. The insight is in the trend.
Pillar 4: Forward-Looking Insights (The “Guidance”)
The past is only interesting insofar as it predicts the future. An insightful report devotes significant space to the outlook.
Note: You don’t have to give precise profit forecasts (which is risky). Instead, give *strategic guidance*.
- Market Outlook: “We expect raw material prices to stabilize in Q2, which should improve our Gross Margins.”
- Strategic Priorities: “Our #1 financial goal for next year is to shorten our Cash Conversion Cycle by 15 days to fund expansion.”
- Risk Management: “We have hedged 80% of our Euro exposure to protect against currency volatility.” (See Risk Management).
This shows investors that you are driving the bus, not just sitting in the passenger seat.
Pillar 5: The “Elephant in the Room” (Addressing Failure)
Nothing builds trust faster than admitting a mistake. Most reports try to spin or hide failures. This insults the reader’s intelligence.
The Insightful Approach: “We missed our launch target for Product X. We underestimated the regulatory approval timeline. We have since hired a new compliance officer and revised our launch process. We expect to launch in Q2.”
This transforms a failure into a demonstration of competence and learning. It builds credibility for when you report your successes.
The Role of Data Integrity: You Can’t Spin Bad Data
You cannot write an insightful report if your underlying numbers are suspect. If your “Other Expenses” line is huge because your bookkeeping is messy, you can’t explain your costs. If your revenue recognition is inconsistent, your growth story is a lie.
Insight starts with accuracy. This requires:
- Clean Bookkeeping: Every transaction categorized correctly. (Link to Bookkeeping Services).
- Monthly Reconciliations: Ensuring the Balance Sheet is real. (Link to Reconciliation Services).
- External Audit: The stamp of approval that proves your story is true. (Link to Audit Services).
How Excellence Accounting Services (EAS) Crafts Your Story
Writing a strategic Annual Report is a high-level skill that requires a blend of accounting knowledge, strategic vision, and communication flair. EAS provides this as a service.
- Outsourced CFO Services: Our CFOs act as your “Chief Editor.” We analyze your year, find the strategic themes, and write the MD&A section that explains the “why” behind the numbers.
- Custom Reporting Design: We don’t just give you a trial balance. We build professional, visual Annual Report decks that are ready for board presentation.
- Data Cleansing & Audit Prep: Our accounting review team ensures your numbers are pristine before they go into the report, preventing embarrassment.
- Strategic Forecasting: We build the forward-looking models that allow you to include credible “Outlook” and “Guidance” sections in your report.
Frequently Asked Questions (FAQs) on Annual Reports
Legally? Maybe not (unless required by your Free Zone or Bank). Strategically? Absolutely. It is the single best discipline for reviewing your strategy. It is also essential if you ever want to sell the business (valuation) or get a loan. It creates a “corporate memory.”
Quality over quantity. For an SME, a 10-15 page report that is rich in insight is far better than a 100-page report of boilerplate text. Focus on the CEO Letter, the Financial Highlights (1 page), the MD&A (3-4 pages), and the Financial Statements.
The **CEO’s Letter to Shareholders**. This is your elevator pitch. It sets the tone. If this letter is boring or generic, people won’t read the rest. Use it to tell the human story of the year.
Don’t just list accounting policies. Use the notes to explain *drivers*. Instead of just saying “Marketing expense was 500k,” add a note: “Marketing spend increased 20% to support the launch of Product Y, which generated 1M in new revenue.” Connect the cost to the return.
Yes! Modern investors look at ESG (Environmental, Social, Governance) and operational metrics. Include Employee Turnover Rate, Customer Satisfaction Score (NPS), or Carbon Footprint. These are leading indicators of future financial health.
You can, but you shouldn’t. Excel default charts are ugly and cluttered. Use a designer or a tool to clean them up. Remove gridlines, simplify labels, and use your brand colors. The visual quality reflects the quality of the company.
You must now disclose your “Effective Tax Rate.” You must explain any difference between your accounting profit and your taxable profit (e.g., disallowable expenses). This “Tax Reconciliation” is a key part of transparency and shows you are managing your tax liability efficiently.
This is when you need a report the most. “Own” the bad news. Use the report to explain *why* it happened (e.g., “One-time restructuring cost”) and show the “Adjusted EBITDA” that proves the underlying business is still healthy. A good explanation can save your stock price or credit rating.
Yes, and they often do a better job than an internal one because they have an objective, outsider’s perspective. They can see the “story” that you might miss because you are too close to the daily grind.
Don’t wait until January. You should be building the narrative *during* Q4. By December, you should have a draft of the strategic sections, so you only need to plug in the final numbers in January. This prevents the “rush job” quality.
Conclusion: Your Story is Your Strategy
Your Annual Report is not a receipt; it is a brochure for your business’s future. It is the one time a year you have the undivided attention of your stakeholders. Do not squander it on dry data tables.
Use it to demonstrate your command of the business. Use it to show that you understand the levers of value creation. Use it to build trust through radical transparency. By turning your Annual Report into a strategic masterpiece, you are not just reporting on the year that passed; you are writing the script for the year to come.